Thursday July 9, 2021
Data Visualizations
Yesterday, I went through a few more steps of visualizing. I get that I am reckoning with this dataset but I also don’t feel satisfied with my visualization skills. On top of that there are some sophisticated ways to get really interesting vizzes that don’t directly involve the library being used, like using for loops, where methods, agg and groupby methods. You can squeeze a lot of extra milage out of a plot by exploiting these techniques.
I want to go through the seaborn tutorials to get some more insight overall, instead of trying to find a specific answer to a question at hand. So, I started at the beginning, and the very first visualization is:
sns.histplot(data=penguins, x=’flipper_length_mm’, hue=’species’, multiple=’stack’)
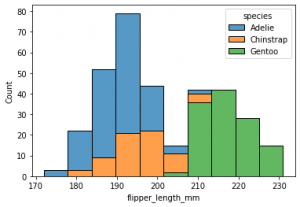
That is simple enough, a one line code and an interesting visualization with minimum effort. You have continuous numerical data in bins which converts the continuous data into discrete to give you a frequency distribution of the flipper length among different species of penguins. The species have been color coded.
I decided that I want to complicate it. I thought I could add a for loop into the mix and produce subplots that would separate based on species and each would show the male/female breakdown.
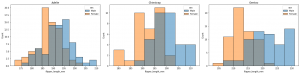
At the moment, I am really trying to get the where method to crystalize in my head better so that I can pull it out and use it without referring to the sytnax. I have achieved this by separating the filter into its own variable then assigning the where method with the filter to the x-value. This helps me keep the elements clear. One is what I what to group by and the other is the feature I want to see. Now, when I call the plot function I just plug x_value into into the x variable. and we don’t have the extensively line to produce the plot.
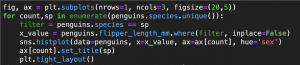
I have also learned to use enumerate to create a counter that can be used to index the ax based on the index of the current penguins.species.unique. I want to practice different modifications at different levels of complexity. This might be turned into a function that I could apply whenever.
So, this is what I applied to my housing dataset. I went from this figure, not very helpful but with good intentions….
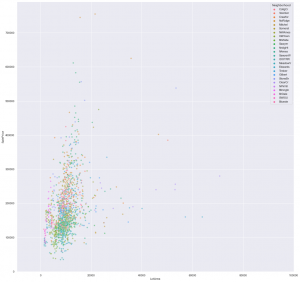
…to this, slightly more helpful….
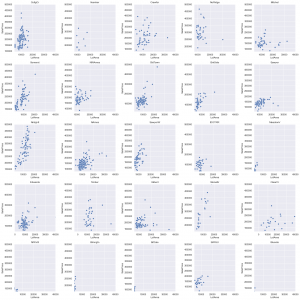
Here you can see the individual breakdown of SalePrice per LotArea of each Neighborhood. They are each on the same x and y scale so we can quickly see if any are off to one side or the other. I could improve this quick glance with a regression line to help see which neighborhoods are better values per area. But easily we can see that Clear Creek (row 4, col 5) offers larger plots of land for lower prices.
We can also see that North Ridge (row 1, col 4) has some of the most expensive land. We are going to have to look at the housing characteristics on these lots also. I just thought that the breakdown of LotArea is telling for how much land at what price. It can be concluded that in general the trend of land and value is upwards.
We will continue our dive into this tomorrow….and the change in rhythm has helped. I really need to get the simple basics while I am experimenting. The pattern I should follow is: follow along, variation, experimentation. The more frequently I can cycle through these steps the better my vizzes seems to get.
Podcast: RealPython episode 55:
This one got into refactoring python code which is a practice that I need to hone.Brendan Maginnis and Nick Thapen from Sourcery were featured guests on the show.
It reminded me of a book I picked up awhile ago by Dane Hillard called Practices of the Python Pro. I highly recommend this book as a guide for aspiring python professionals. It gives clear driving concepts behind designing good code which is both clear and useful for others reading it. I might go into depth with this because I don’t think these principles could be repeated enough: Loose coupling, Intuitability, Flexibility, and Extensibility.